Gold Stumbles After Testing 1200 Figure, SPX 500 Pauses to Digest Gains
Talking Points:
- US Dollar Hits Five-Year High as Upward Momentum Rebuilds
- S&P 500 Pauses to Digest Gains After Setting Another Record
- Crude Oil Struggles to Build Higher, Gold Recoils from $1200
Can’t access the Dow Jones FXCM US Dollar Index? Try the USD basket on Mirror Trader. **
US DOLLAR TECHNICAL ANALYSIS – Prices advanced to a five-year high the greenback resumed its march higher following a brief period of consolidation. A daily close above the 23.6% Fibonacci expansionat 11315 exposes the 38.2% level at 11374. Alternatively, a turn below the 14.6% expansion at 11278 opens the door for a challenge of the November 17 low at 11219.
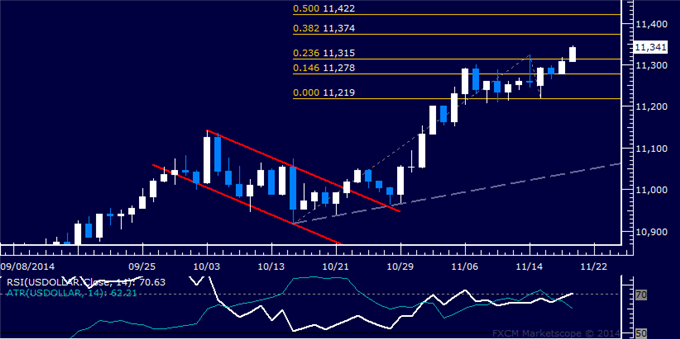
Daily Chart - Created Using FXCM Marketscope 2.0
** The Dow Jones FXCM US Dollar Index and the Mirror Trader USD basket are not the same product.
S&P 500 TECHNICAL ANALYSIS – Prices paused to consolidate after clearing resistance at 2051.00, the 23.6% Fibonacci expansion, to expose the 38.2% level at 2081.20. A further push beyond that targets the 50% Fib at 2105.60. Alternatively, a reversal back below 2051.00 on a daily closing basis targets the 2022.10-32.30 area marked by the 14.6% expansion and the September 19 high.
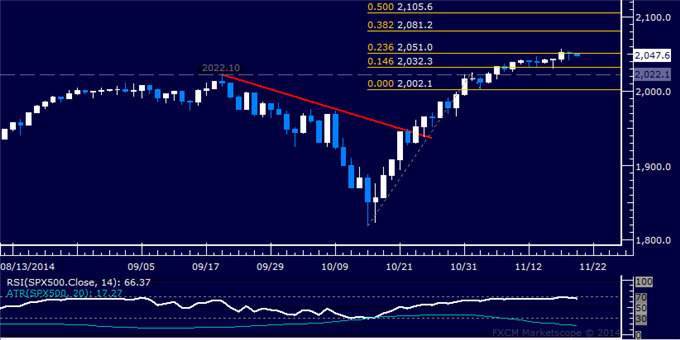
Daily Chart - Created Using FXCM Marketscope 2.0
GOLD TECHNICAL ANALYSIS – Prices paused to digest gains after hitting a three-week high above the $1200/oz figure. A daily close above the 38.2% Fibonacci retracement at 1212.23 exposes the 1229.19-37.59 area marked by a falling trend line and the 50% level. Alternatively, a reversal below the 1178.86-80.84 zone (December 2013 low, 23.6% Fib) targets the 14.6% retracement at 1161.49.
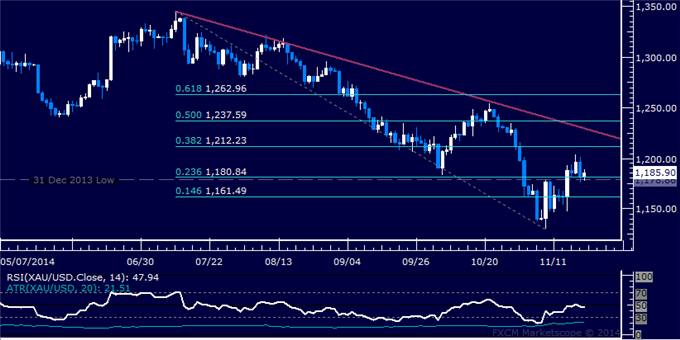
Daily Chart - Created Using FXCM Marketscope 2.0
CRUDE OIL TECHNICAL ANALYSIS – Prices may be gearing up for a recovery after putting in a bullish Piercing Line candlestick pattern. A break above the 14.6% Fibonacci retracement at 79.81 exposes the 23.6% level at 81.71. Near-term support is at 76.74, the November 14 low.
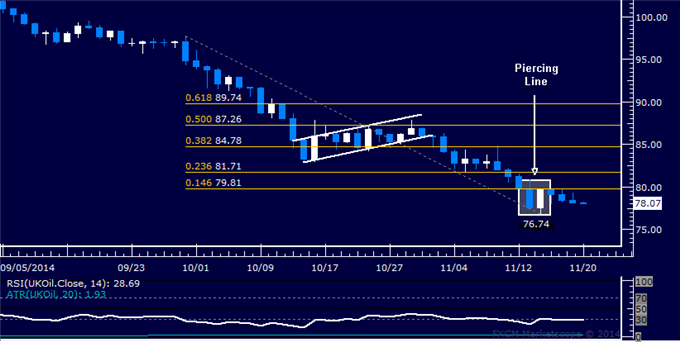
Daily Chart - Created Using FXCM Marketscope 2.0
--- Written by Ilya Spivak, Currency Strategist for DailyFX.com
To receive Ilya's analysis directly via email, please SIGN UP HERE
Contact and follow Ilya on Twitter: @IlyaSpivak
original source


 Indonesia