Crude Oil and Gold Locked in Ranges, SPX 500 Drops Most in 4 Months
Talking Points:
- US Dollar May Be Topping After Hitting 6-Year High
- S&P 500 Drops Most in Nearly 4 Months to Test 2000
- Crude Oil, Gold Remain Locked in Familiar Ranges
Can’t access the Dow Jones FXCM US Dollar Index? Try the USD basket on Mirror Trader. **
US DOLLAR TECHNICAL ANALYSIS – Prices may be readying to turn lower after producing a bearish Evening Star candlestick pattern. A daily close below the intersection of the 14.6% Fibonacci retracement and a rising trend line at 11725 exposes the 23.6% level at 11640. Alternatively, a reversal above the 11854-88 area marked by the March 2009 high and the 38.2% level opens the door for a challenge of the 50% Fib at 11983.
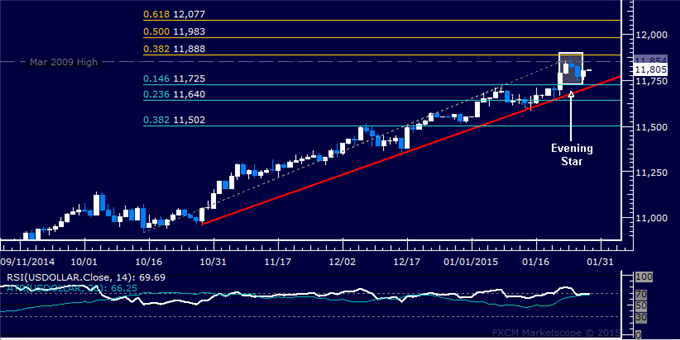
Daily Chart - Created Using FXCM Marketscope
** The Dow Jones FXCM US Dollar Index and the Mirror Trader USD basket are not the same product.
S&P 500 TECHNICAL ANALYSIS – Prices declined as expected after putting in a bearish Evening Star candlestick pattern. A daily close below 1996.10, the intersection of the 61.8% Fibonacci expansion and a rising trend line, exposes the 76.4% level at 1979.10. Alternatively, a turn back above the 50% Fib at 2009.80 aims for the 38.2% expansion at 2023.60.
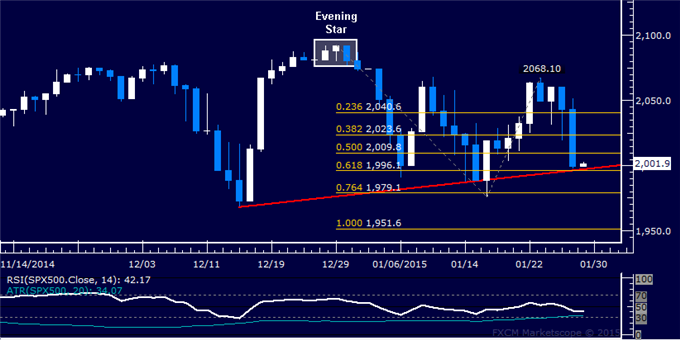
Daily Chart - Created Using FXCM Marketscope
GOLD TECHNICAL ANALYSIS – Prices continue to consolidate after finding resistance above the $1300/oz figure. A daily close below the 23.6% Fibonacci retracement at 1274.30 exposes the 1253.77-55.20 area marked by the October 21 high and the 38.2% level. Alternatively, a push above the 14.6% Fib expansion at 1292.73 targets the 23.6% threshold at 1305.39.

Daily Chart - Created Using FXCM Marketscope
CRUDE OIL TECHNICAL ANALYSIS – Prices are stalling having attempted to recover as expected. A daily close above the 14.6% Fibonacci retracement at 50.49 exposes the 23.6% level at 53.77. Alternatively, a reversal below the 14.6% Fib expansion at 47.07 targets the 23.6% threshold at 43.79.
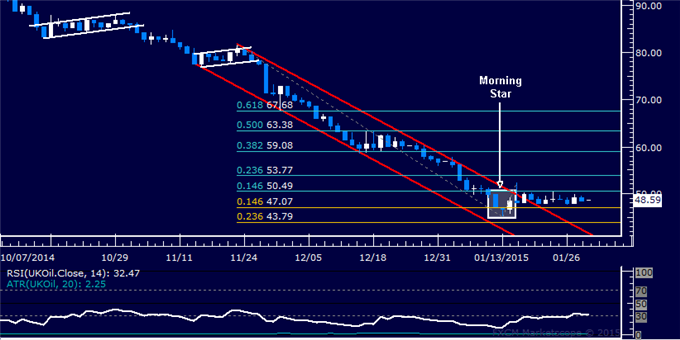
Daily Chart - Created Using FXCM Marketscope
--- Written by Ilya Spivak, Currency Strategist for DailyFX.com
To receive Ilya's analysis directly via email, please SIGN UP HERE
Contact and follow Ilya on Twitter: @IlyaSpivak
original source


 Indonesia